
National Multidimensional Poverty Index
The National Multidimensional Poverty Index (MPI) is an indicator used to measure and assess poverty beyond the traditional income-based approach.
Unlike the traditional poverty measure that focuses solely on income, the MPI takes into account various dimensions of deprivation that individuals or households may face, providing a more comprehensive understanding of poverty and its complexities.
Content of the National Multidimensional Poverty Index:
- Multidimensionality: The MPI acknowledges that poverty is a multi-faceted phenomenon and includes several dimensions, such as health, education, living standards, and social protection, among others. By considering these multiple dimensions, the index provides a more nuanced view of poverty.
- Deprivation cutoffs: The MPI defines specific indicators for each dimension, representing various aspects of well-being. For example, indicators might include factors like nutrition, child mortality, years of schooling, access to clean water, and sanitation. The absence or inadequacy of these indicators indicates deprivation in the respective dimension.
- Thresholds for poverty: To assess whether an individual or household is considered "poor" or not, the MPI sets cutoffs for the number of deprivations a person or household experiences. If someone lacks a certain number of indicators across different dimensions, they are considered to be living in poverty.
- Weighting of dimensions: The MPI assigns different weights to each dimension to reflect their relative importance in contributing to overall poverty. For instance, education might be given more weight than access to electricity, depending on the country or context.
- Comparability and international standards: The MPI allows for cross-country comparisons, providing insights into the variations and similarities in poverty experiences globally. However, countries may adapt the index to suit their specific contexts and needs.
- Dynamic nature: The MPI can be recalculated over time to monitor changes in poverty levels and track progress in poverty reduction efforts. This dynamic nature helps policymakers to evaluate the effectiveness of interventions and make informed decisions.
- Policy implications: The MPI goes beyond identifying the poor; it also helps identify the specific deprivations that households face. This information can be instrumental in designing targeted policies and programs to address the root causes of poverty and uplift the most vulnerable populations.
Overall, the National Multidimensional Poverty Index is a valuable tool for policymakers and researchers to gain a comprehensive understanding of poverty, guide policy formulation, and measure progress in addressing poverty and improving well-being in a more holistic manner.
What is multidimensional poverty?
This is the second edition of Niti Aayog’s report on the Multidimensional Poverty Index (MPI).
- It captures overlapping deprivations in health, education and living standards and other broader qualitative aspects of life, like child mortality, housing conditions, and other basic services such as water and sanitation to ascertain multidimensional poverty.
The primary data source to arrive at these figures was National Family Health Survey-5 (NFHS-5).
- Under the three broad indicators of health, education and living standards, Niti Aayog assigns specific dimensions – such as nutrition and child adolescent mortality under health, years of schooling under education, and access to cooking fuel, electricity, bank accounts etc. under quality of living.
- Each of these specific parameters are assigned a value to calculate what is called a ‘deprivation score’.
- The deprivation score is the sum of the weighted status of all the indicators for an individual – if it is more than 0.33, only then an individual is considered multidimensionally poor.
How have various states fared in the multidimensional poverty index?
- The good news is that the number of states with less than 10 percent people living in multidimensional poverty doubled in the five years between 2016 and 2021.
- According to the report, in 2015-16 (NFHS-4), only seven states had less than 10 percent of their population living in multidimensional poverty — Mizoram, Himachal Pradesh, Punjab, Sikkim, Tamil Nadu, Goa, and Kerala.
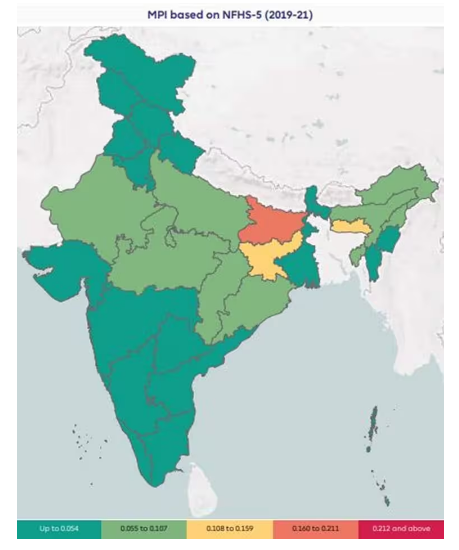
In the above image, based on 2019-21 (NFHS-5) data, 14 states now have less than 10 percent of the population living below the poverty line. It includes Mizoram, Himachal Pradesh, Punjab, Sikkim, Tamil Nadu, Goa, Kerala, Telangana, Andhra Pradesh, Haryana, Karnataka, Maharashtra, Manipur, and Uttarakhand. (Source: NITI Aayog report)
- However, in 2019-21 (NFHS-5), the list had doubled to include 14 states, with the seven new additions being Telangana, Andhra Pradesh, Haryana, Karnataka, Maharashtra, Manipur, and Uttarakhand.
- Except for Bihar, no other state in India has more than one-third of its population living in multidimensional poverty.
- However, even in Bihar’s case, the reduction in multidimensional poverty has been significant over the five year time period – in 2015-16, over 51.89 per cent of Bihar’s population lived in multidimensional poverty. By 2019-21, the figure had dropped to 33.76 per cent.
- Jharkhand reduced the percentage of people living under multidimensional poverty from 42 per cent in 2015-16 to 28.82 per cent in 2019-21, Uttar Pradesh saw a decline from 37.68 per cent to 22.93 per cent, and in Madhya Pradesh, multidimensional poverty dropped from 36.57 per cent to 20.63 per cent.
What is the status of poverty in India?
- In absolute terms, approximately 13.5 crore Indians escaped poverty between the five year time period, courtesy of improvements in indicators like access to cooking fuel, sanitation, drinking water, and bank accounts, among others.
- However, the report, titled ‘National Multidimensional Poverty Index: A Progress Review 2023’ showed that when it came to indicators like nutrition and access to education, the improvement has only been marginal, as these parameters contributed the most in keeping one in seven Indians multidimensionally poor.
- While there continues to be a major disparity between the number of people in poverty in rural and urban areas, the former witnessed the fastest decline in poverty from 32.59 per cent to 19.28 per cent, owing to improvements in states like Bihar, Uttar Pradesh, Madhya Pradesh, Odisha, and Rajasthan.
What is keeping Indians multidimensionally poor?
- Even as there has been a significant reduction in the number of multidimensionally poor individuals, it is worth noting that one in seven Indians continue to fall under that category – primarily because poverty reduction is not equally represented in the three main indicators of standard of living, health, and education.
- Within the health category, three sub-indicators — nutrition, child and adolescent mortality, and maternal health — showed only moderate improvement, the report showed.
- Nutrition deprivation decreased from 37 per cent to 31 per cent, maternal health deprivation improved from 22.5 per cent to 19.17 per cent, and child and adolescent mortality deprivation declined from 2.69 per cent to 2.06 per cent.
- Lack of proper nutrition contributed close to 30 per cent — the highest — in the overall calculation of India’s multidimensional poverty index. “Contributing to nearly one-third of the multidimensional poverty in India, nutrition is arguably one of the most important indicators in India’s national MPI,” the report said.
- A household is considered nutritionally deprived if any child between the ages of 0 to 59 months, or woman between the ages of 15 to 49 years, or man between the ages of 15 to 54 years – for whom nutritional information is available – is found to be undernourished. A woman or a man is considered undernourished if their Body Mass Index (BMI) is below 18.5 kg/m2.
- Children under 5 years of age are considered malnourished if their z-score of height-for-age (stunting) or weight-for-age (underweight) is below minus two standard deviations from the median of the reference population. Even if a single member of the household is identified as undernourished, the entire household is treated as deprived of nutrition.
- Other indicators that did not record a significant decline and aided the most in keeping Indians poor include lack of years of schooling (16.65%), inadequate access to maternal health services (11.73%), and less-than-desired school attendance (9.10%), among others.
- Also, while there has been a significant improvement in access to cooking fuel, it is worth noting that close to 44 per cent of India’s population is still deprived of it. Similarly, while sanitation numbers have improved, more than 30 per cent of the population is deprived when it comes to sanitation services.
- Access to housing also remained to be an indicator where the improvement was only marginal. In 2015-16, close to 46 per cent of the population did not have such access, and in 2019-21, more than 41 per cent Indians still did not have access to housing.
|
IN NEWS? |
Source: https://indianexpress.com/article/explained/explained-economics/multidimensional-poverty-india-niti-aayog-8845935/


