There are no poor in India
Relevance: GS Paper III
Why in News?
The CEO of NITI Aayog claimed that less than 5% of India's population is poor, based on the Household Consumption Expenditure Survey (HCES) results.
Household Consumption Expenditure Survey (HCES):
- HCES was conducted between August 2022 and July 2023 and published by the National Sample Survey Office.
- The aim is to calculate the monthly per capita expenditure (MPCE) at current/nominal prices.
- It collected information from 8,723 villages and 6,115 urban blocks covering 2,61,745 households (60% in rural areas and 40% in urban areas).
Proportion of the poor - a subject of debate and analysis:
- The percentage of people living in poverty in India is a critical indicator, often analyzed and debated.
- Earlier, NITI Ayog announced that its estimated proportion of multi-dimensionally poor people was 11.28%.
- Now, its CEO has announced his discovery that the poor in India are no more than 5% of the population.
- According to the critics, the HCES results likely indicated a higher proportion of people living below the poverty line.
Reading Data:
- On average, a person’s monthly expenditure was:
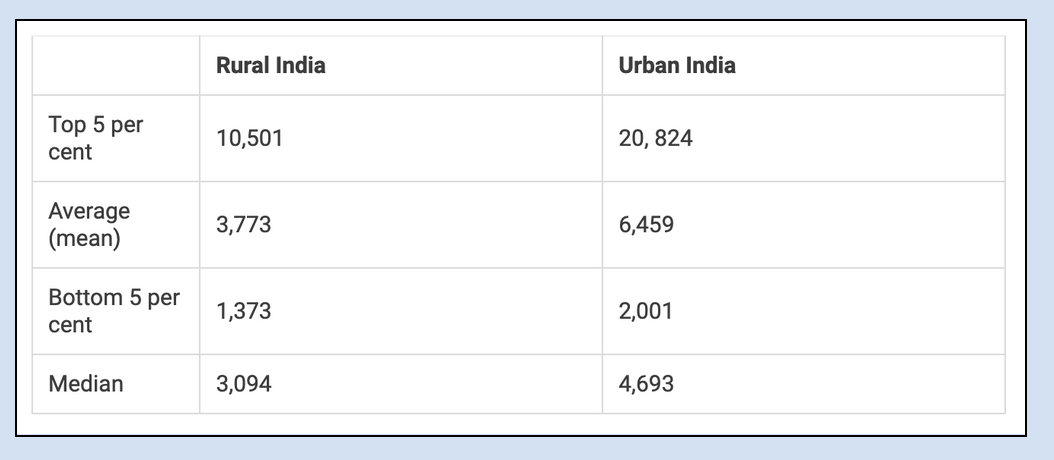
- Median expenditure means that 50% of the total population per capita was no more than Rs 3,094 (rural) and Rs 4,963 (urban).
- Take the bottom 50%. Go down fractile by fractile. Statement 4 of the Report gives the numbers:
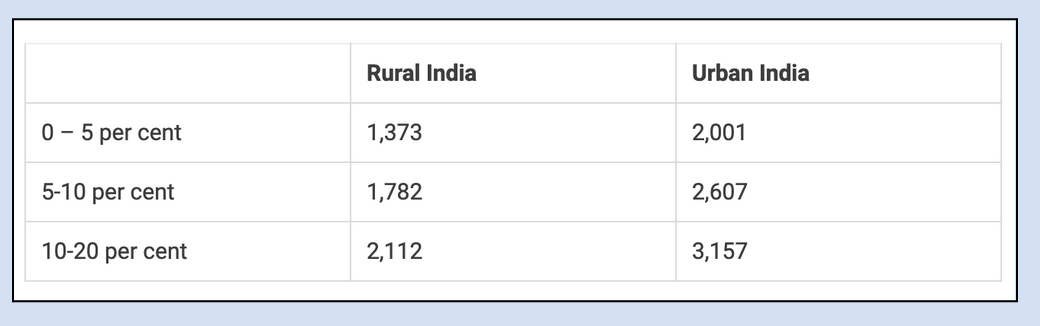
- Let’s stop at the bottom 20%.
- How can any person whose monthly spend (on food and non-food) is about Rs 2,112 or Rs 70 a day in rural areas not be poor?
- Or any person whose monthly spend is Rs 3,157 or Rs 100 a day in urban areas is not poor?
Observed realities:
- HCES revealed that the share of food in consumption had reduced to 46% in rural areas and 39% in urban areas.
- That is probably true because of rising income/expenditure and the value of food consumption remaining the same or rising at a slower rate.
- Scheduled castes and Scheduled tribes are the poorest social groups. They are below the average. OBCs are near the average.
- It is the ‘others’ who are above the average.
- The poorest citizens are those who live in Chhattisgarh, Jharkhand, Odisha, Madhya Pradesh, Uttar Pradesh, West Bengal and Meghalaya — their MPCE is below the all-India average MPCE for rural areas.
- Gujarat's score is slightly above that of the all-India average MPCE in rural areas (Rs 3,798 vs Rs 3,773) as well as in urban areas (Rs 6,621 vs Rs 6,459).
Blind to the poor:
- The NITI Ayog’s CEO claim of 5% of poor population is also in contradiction with-
- The government currently distributing 5 kg of free grain per person per month to 80 crore people.
- After all, cereal and substitutes account for only 4.91 per cent (rural) and 3.64 per cent (urban) of the total MPCE.
- The National Family Health Survey-5 recorded the following alarming facts:
|
People |
Percent |
|
Children aged 6-59 months who are anaemic |
67.1 |
|
All women age 15-49 years who are anaemic |
57.0 |
|
Children under 5 years who are stunted |
35.5 |
|
Children under 5 years who are wasted |
19.5 |
-
- 15.4 crore active registered workers under MGNREGS.
- Ujjwala beneficiaries, on average, buy only 3.7 cylinders in a year.
Conclusion:
The poverty level in India is a widely discussed and analyzed subject. It is crucial for the authorities to understand the significance of precise and comprehensive consumption statistics. There is a requirement to effectively use the HCES data to create policies and schemes that can help reduce the actual levels of poverty.
|
Beyond Editorial Significance of Household Consumption Expenditure Survey (HCES):
Understanding BPL (Below Poverty Line):
|
Prelims PYQ
Q. In a given year in India, official poverty lines are higher in some States than in others because (UPSC 2019)
(a) Poverty rates vary from State to State
(b) Price levels vary from State to State
(c) Gross State Product varies from State to State
(d) Quality of public distribution varies from State to State
Mains PYQ
Q. Though there have been several different estimates of poverty in India, all indicate reduction in poverty over time. Do you agree. Critically examine with reference to urban and rural poverty indicators. (UPSC 2015)