
Summary of chapter 4 economic survey
CHAPTER 4 : Monetary Management & Financial InterMediation: A Good year
Introduction
- The chapter provides an introduction to the most recent government's monetary policies, financial management through monetary policies during the Covid-19 period, liquidity conditions of various economic sectors, the transmission of monetary policy and the role of banks in credit issuance, credit growth in India, NBFCs and their performance after Covid-19, the role of the insolvency and bankruptcy code in easy resolvency of Startup's in India, the significance of IFSC-GIFT CITY, and the development of the internet.
Monetary developments
- Commodity prices skyrocketed due to the European conflict, dramatically escalating the high inflationary pressures. This trend has set off the present strong and synchronous monetary tightening cycle.
- After executing a 115 basis point (bps) drop between March 2020 and May 2020, the Monetary Policy Committee (MPC) kept the status quo on the policy repo rate between May 2020 and February 2022.
- As the new floor of the Liquidity Adjustment Facility (LAF) corridor, the Standing Deposit Facility (SDF) replaced the reverse repo rate at 3.75 per cent. The reverse repo rate was replaced as the new floor of the Liquidity Adjustment Facility (LAF) corridor by the SDF, which was launched at a rate of 3.75 per cent.
- The policy repo rate, the SDF, and the Marginal Standing Facility (MSF) were all raised by 40 basis points (bps) apiece, and the Cash Reserve Ratio was raised by 50 bps (CRR).
- M0, the reserve currency, climbed by 10.3% per cent as of December 30, 2022, compared to last year, when it increased by 13%. However, the reserve money reported a YoY growth of 7.8 per cent as opposed to 9.1 per cent a year after being adjusted for the first-round impact of modifications in the Cash Reserve Ratio (CRR).
- Except for a slight uptick during the start of the Russia-Ukraine crisis, which can be attributed to a spike in precautionary holdings, Currency in Circulation (CIC) growth has remained constant at levels recorded after COVID-19.
- Broad money stock (M3) grew 8.7% as of December 30, 2022. When looking at the components, aggregate deposits have been the biggest factor and have been mainly responsible for the growth of M3 this year.
- The money multiplier, or the ratio of M3 to M0, has largely remained consistent at 5.1 from April to December 2022, down from 5.2 over the same time period in 2017.
Liquidity conditions
- The Liquidity Adjustment Facility (LAF) corridor became symmetric around the policy repo rate when the Marginal Standing Facility (MSF) rate was maintained at 25 bps above the policy repo rate; the corridor width was subsequently restored to 50 bps, the situation that existed prior to the pandemic. Primary liquidity of Rs. 87,000 crores was removed from the banking system due to the RBI's decision to increase the CRR by 50 bps.
- Liquidity management by RBI: With two-way operations, the Reserve Bank maintained its flexibility and agility in managing liquidity. With two variable rate repo (VRR) auctions of 50,000 crores each, it injected cash to ease temporary liquidity tightness. The weighted average call rate (WACR), the operating aim of monetary policy, moved steadily closer to the policy repo rate as surplus liquidity was gradually removed.
Monetary policy transmission
- External benchmark-based lending rate and the 1-year median marginal cost of funds-based lending rate (MCLR) grew by 225 basis points and 115 basis points, respectively, during FY23 (up to December 2022). According to an analysis of transmission across bank groups during FY23 (up to November 2022), public sector banks experienced a greater increase in the weighted average lending rate (WALR) on new loans, while private banks experienced a greater increase in the WADTDR on outstanding deposits and the WALR on outstanding loans.
Development in G- sec markets
- The yield on the 10-year government bond increased in 2022 after holding constant in 2020 and 2021. After reaching a peak of 7.5 per cent in June 2022, the 10-year government bond's monthly average yield was 7.3 per cent in December 2022. In the second half of 2022, volatility also decreased along with the easing of yields.
- The trade volume in G-Secs (including T-Bills and SDLs) increased 6.3 per cent in Q2 FY23 to a two-year high.
- Secondary Market: Foreign banks and principal dealers were net sellers on a comparative basis. On the other hand, in the secondary market, net buyers included public sector banks, cooperative banks, financial institutions, insurance companies, mutual funds, private sector banks, and "others."
Banking sector
- Resilient and well-capitalized Banking System: Over time, SCBs' asset quality has increased consistently across all significant industries. At 1.3 per cent of total assets, Net Non-Performing Assets (NNPA) have reached a ten-year low. Fewer slippages brought on this decrease, and the decline in outstanding GNPAs brought on by recoveries, upgrades, and write-offs. A decrease in NNPA was caused by lower GNPAs and excessive provisions amassed in recent years.
- The Provisioning Coverage Ratio (PCR), which has been rising continuously since March 2021 due to falling GNPAs, reached 71.6 per cent in September 2022. Even with the 11.5 per cent Capital Conservation Buffer (CCB) rule, it is still far above the minimum capital needed.
- Regarding Return on Equity (ROE) and Return on Assets (ROA), SCB profitability increased to levels last seen in FY15. Profit After Tax (PAT) increased by a system-wide double-digit 40.7 per cent in the quarter ending September 2022, driven by a robust rise in Net Interest Income (NII) and a sizable provision reduction. According to RBI's macro-stress tests for credit risk, all banks can meet the minimum capital requirements even in challenging stress situations because SCBs are well-capitalized.
Credit growth is aided by a strong banking system and deleverage corporate sector.
- From June 2021, the growth of non-food bank loans has been supported by the improvement in the financial soundness of banks and corporations and the rebound in economic activity in FY22. In December 2022, the growth in non-food bank credit quickened to 15.3 percent.
- The government's greater agricultural credit objective and concessional institutional credit policy helped loans to agriculture and related activities gain momentum. A rise in credit to MSMEs has boosted industrial credit growth, which has also been helped by the advantages of the Emergency Credit Line Guarantee Scheme (ECLGS), the government's production-linked incentive programme, and an increase in capacity utilization.
- During FY23, reliance on bank borrowing for supporting ongoing operations and capacity expansion increased while money raised from the main domestic equity market segment decreased. The incremental credit-deposit ratio also increased significantly on both an annual and half-yearly basis.
Non-banking financial companies(NBFCs) continue to recover.
- The dropping GNPA ratio of NBFCs from the peak of 7.2 per cent recorded during the second wave of the pandemic (June 2021) to 5.9 per cent in September 2022, approaching the pre-pandemic level, demonstrates the ongoing improvement in asset quality.
- The capital position of NBFCs also remains strong in the face of the drop in GNPAs, with a CRAR of 27.4 percent at the end of September 2022, just a hair lower than the 27.6 per cent in March 2022. It continues to be far above the legal requirement, nevertheless. The rise in risk-weighted assets (RWAs) as lending increased was the main cause of the drop of 20 basis points.
- The quantity of credit given by NBFCs is increasing, with a total outstanding balance of 31.5 lakh crore as of September 2022. The industrial sector continues to get the highest amount of credit from NBFCs' balance sheets, followed by the retail, service, and agricultural sectors.
Progress made under the insolvency and bankruptcy code
- Ease of doing business: Facilitating the "exit" process: By the end of September 2022, 5,893 Corporate Insolvency Resolution Processes (CIRPs) had started, of which 67 per cent had been completed since the IBC's establishment in December 2016. A Corporate Debtor (CD) may also choose to liquidate itself voluntarily under the terms of the Code, provided that specific requirements are met.
- Behavioural change: Recoding Business Relationships: Many debtors have been pushed to pay their debts even before the start of insolvency procedures out of a concern of losing control of the CD upon the start of CIRP.
- Sixty-nine per cent of the distressed assets were rescued, realization value of around 178 per cent of the liquidation value: The resolution plans realized a total of 2.4 lakh crore for the CIRP initiators (which comprises Financial Creditors, Operational Creditors, and Corporate Debtors), which is 177.6 per cent of the liquidation value and 841 per cent of the fair value of the 553 CDs saved.
- Ninety-two per cent of the value realized under the liquidation Process: For the CIRP initiators (financial creditors, operational creditors, and corporate debtors), the resolution plans generated total proceeds of 2.4 lakh crore, or 177.6 per cent of the liquidation value and 841 per cent of the fair value of the 553 CDs preserved.
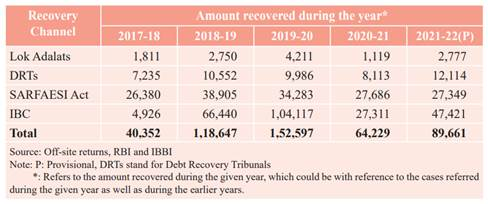
- NPAs: IBC recovers highest amount for Scheduled Commercial Banks: According to data from the RBI, SCBs under IBC recovered the most money overall in FY 22 when compared to other channels like Lok Adalats, the SARFAESI Act, and DRTs.
Primary market
- Debt: Private debt placements more than make up for the lack of public debt issuances: The primary market's resource mobilisation grew by 5% as a result of the issue of debt securities. The overall number of concerns grew by 11% during the same time period. Nonetheless, private debt placements more than made up for the lack of activity in governmental debt issuances. When compared to the same period in the previous year, the number of private debt placements climbed by 11% and the amount of resources mobilised by 6%
Secondary market
- Stock Market Performance: India's stock market has performed well despite the geopolitical unrest that gripped the world in April–December 2022. The blue-chip index Nifty 50 of the Indian stock market, on the other hand, registered a return of 3.7 per cent during the same period. The Sensex closed 3.9 percent higher at the end of December 2022 than it had on March 31, 2022.
- Stock market volatility rose due to the post-Russia-Ukraine crisis supply chain disruption and heightened geopolitical uncertainty. With the start of the Russia-Ukraine conflict, the India VIX, which gauges anticipated short-term volatility in the stock market, reached a high of 32.0 on February 24, 2022. The India VIX experienced a falling trend from April to November 2022 as the conflict's effects began to lessen throughout the year.
- Retail Participation in the Capital Market: Compared to the same period in FY22, the percentage of individual investors in the cash segment somewhat decreased during FY23 (April-November 2022). On a year-over-year basis, demat accounts increased significantly, jumping by 39% at the end of November 2022.
- Commodity Derivatives Market: severe correction due to the Fed's tightening of credit: The conflict between Russia and Ukraine caused disruptions in the supply of commodities, particularly those related to energy, base metals, and food. As a result, there was a dramatic increase in the price of crude oil and some base metals like nickel and aluminum. Nevertheless, commodities prices have significantly improved since the Federal Reserve began raising interest rates in March 2022 to fight growing inflation.
- Mutual Funds witnessed lower net inflows: Net inflows to mutual funds were much lower than the previous year. Nevertheless, specific growth/equity-oriented and solution-oriented schemes saw inflows much greater than they had been the year before during the same period. Despite this, the market's performance led to a growth in assets under management (AuM) of 8.1 per cent for the mutual fund sector at the end of November 2022.
Foreign portfolio investment
- Macroeconomic solid fundamentals ensure India remains an attractive destination: FPIs were under pressure to sell in Indian markets due to global economic reasons such as inflationary pressures, monetary tightening by central banks, and recessionary fears in Advanced Economies. Also, investors had gained from Indian stock holdings that they might sell to offset losses elsewhere. Compared to November 2021, the total assets under custody with FPIs increased by 3.4% at the end of November 2022.
- At the end of December 2022, the total net investments by Foreign Portfolio Investors for FY23 had decreased to 16,153 crores from 5,578 crores at the end of December 2021. Net FPI outflows were seen in both the debt and equities sectors.
- In recent years, investments made by domestic institutional investors (DIIs) countered FPI outflows, making the Indian equity market substantially less vulnerable to sharp declines. During FY23, mutual funds made net equity investments and net DII inflows (until November 2022).
Other developments
- The necessity of a common approach to regulating the crypto ecosystem: The recent failure of the cryptocurrency exchange FTX and the subsequent sell-off in the crypto markets have highlighted the need for more in the ecosystem for cryptocurrencies. Because they lack any underlying cash flows, crypto-assets do not meet the criteria for being considered financial assets. Instead, they are self-referential instruments. Bitcoin, Ether, and a number of other crypto assets are no longer considered securities by US regulators. On January 3, 2023, the Federal Reserve, Federal Deposit Insurance Corporation (FDIC), and Office of the Comptroller of the Currency (OCC) issued a rare joint statement outlining their concerns about the potential hazards crypto assets pose to the financial system.
IFSC- GIFT CITY
- The most crucial is creating and launching GIFT City's first International Financial Services Centre (IFSC). The objective is to help India become a significant economic force by hastening the establishment of a solid international financial services sector there.
|
GIFT IFSC - emerging as a preferred Jurisdiction for International financial services
|
DEVELOPMENT IN THE INSURANCE MARKET
- Insurance markets globally have demonstrated remarkable flexibility and resilience in overcoming the impact of the pandemic: Internationally, the potential and effectiveness of the insurance sector are typically evaluated using two parameters, namely "insurance penetration," which refers to the ratio of total insurance premiums to Gross Domestic Product (GDP) in a year, and "insurance density," which refers to the ratio of insurance premium to population, i.e., insurance premium per capita and is measured in US Dollars, as they reflect the level of development of the insurance sector in a country.
- India is poised to emerge as one of the fastest-growing insurance markets in the coming decade: From 2.7 percent at the turn of the millennium to 4.2 percent in 2020 and staying the same in 2021, insurance penetration in India increased substantially. In 2021, India had a life insurance penetration rate of 3.2%, somewhat higher than the global average and nearly twice as high as the emerging countries. Yet, with only a minor protection component, most life insurance plans offered in India are savings-linked.
- IRDAI (Micro Insurance) Regulations, 2015, which provide a platform for distributing insurance products that are affordable for the rural and urban poor and promote financial inclusion, were released by the Insurance Regulatory and Development Authority of India (IRDAI) in order to facilitate the penetration of insurance to lower income segments of the population.
- The Pradhan Mantri Fasal Bima Yojana (PMFBY), the government's main programme for crop insurance, has significantly increased premium income. In order to cover secondary and tertiary care hospitalization, Ayushman Bharat (Pradhan Mantri Jan Arogya Yojana) (AB PMJAY) seeks to provide a health cover of $5 lakhs per family per year.
- . As per the Swiss Re Institute World Insurance: Report titled "Inflation Risks Front and Center" 13, One of the world's insurance markets with the quickest growth is India. With an estimated market share of 1.9 per cent, it was the second-largest of all emerging markets in 2021 in total premium volumes.
PENSION SECTOR
- India’s Pension Sector demonstrated remarkable performance during Covid-19: The Indian government has proposed a number of initiatives to pay pensions to families that have lost earning members as a result of Covid. Moreover, it made efforts to improve and liberalise insurance compensation. Even individuals who lost earning members as a result of Covid-19 are now eligible for the benefits of the Employees State Insurance Corporation (ESIC) pension plan. Also improved and liberalised were the insurance benefits offered by the Employees Deposit Linked Insurance (EDLI) programme.
- Almost three crore elderly, widowed, and crippled people in need (over the age of 60) received $1,000 in ex-gratia payments from April to June 2020. In light of the unprecedented pandemic, Rule 64 of the CCS (Pension) Regulations, 1972 was relaxed to ensure prompt provisional approval of pensionary payments.
- An Electronic Pension Payment Order (e-PPO) was merged with Digi Locker, generating a permanent PPO record in the Digi Locker, to improve the "Ease of Living" for Central Government Civil Pensioners.
- Under the National Social Assistance Programme (NSAP), the Government of India is implementing a number of pension programmes, including the Indira Gandhi National Old Age Pension Scheme (IGNOAPS), Indira Gandhi National Widow Pension Scheme (IGNWPS), and Indira Gandhi National Disability Pension Scheme (IGNDPS), with a total beneficiary coverage of 4.7 crores.
- The principal defined benefit pay-as-you-go pension system for government employees, the National Pension System (NPS), was established in January 2004. A defined contribution plan with government co-contribution is the NPS for government employees.
- APY was launched by the government in June 2015 as a component of the overall goal of supplying universal social security. The programme is open to everyone between the ages of 18 and 40, with a focus on disadvantaged, disorganized, and low-income individuals.
- PFRDA has made a number of efforts to improve financial education under the direction of the Financial Stability and Development Council (FSDC), so that consumers can make informed decisions and take advantage of the formal financial sector while being aware of the risks and different trade-offs involved. They include outreach initiatives through trade associations, intermediaries like banks, and town hall meetings, as well as pension education through print and electronic media.
OUTLOOK
- The substantial growth in the AuM of domestic mutual funds, the excellent capital levels of NBFCs, and the sound balance sheets of banks all demonstrate the robustness of the domestic financial sector. The improvement in asset quality, the return to profitability, and the robust capital and liquidity buffers are contributing to the brisk demand for bank lending and the early indications of a recovery in the investment cycle.
- By 2032, India, one of the insurance markets with the fastest growth worldwide, is anticipated to rank among the top six. A greater flow of long-term capital, a global technology, processes, and international best practices are likely to be made possible by the digitization of the Indian insurance market and an increase in the FDI limit for insurance companies, which will support the expansion of the Indian insurance industry.


